# imports and setup
import math
import pandas as pd
import numpy as np
from scipy.stats.stats import pearsonr
import matplotlib
import matplotlib.pyplot as plt
from mpl_toolkits.mplot3d import Axes3D # for 3D plots
import seaborn as sns
%matplotlib inline

pd.set_option('precision', 2) # number precision for pandas
plt.style.use('seaborn-white')
sns.set_context("notebook", font_scale=1.5, rc={"lines.linewidth": 2.5})2 Statistical Learning
|
|

|
2.1 Basic Commands
Refer to Numpy notebook for more detail
# vector
x = [1,3,2,5] # do not use this
x = np.array([1, 6, 2]) # use ndarray instead
y = np.array([1, 4, 3])
x.shape, y.shape
((3,), (3,))(array([[1, 2],
[3, 4]]), False)(array([[1, 2],
[3, 4]]), True)array([[1. , 1.41421356],
[1.73205081, 2. ]])2.2 Graphics
Here, we review some of the command we have learned using Seaborn
x = np.random.randn(100)
y = np.random.randn(100)

# seaborn scatterplot
p = sns.jointplot(x=x, y=y, kind='scatter')
p.set_axis_labels(xlabel='this is x axis', ylabel='this is y axis')
We will often want to save the output of an Python plot. The command that we use to do this will be the savefig().
array([-3.14159265, -3.01336438, -2.88513611, -2.75690784, -2.62867957,
       -2.5004513 , -2.37222302, -2.24399475, -2.11576648, -1.98753821,
       -1.85930994, -1.73108167, -1.60285339, -1.47462512, -1.34639685,
       -1.21816858, -1.08994031, -0.96171204, -0.83348377, -0.70525549,
       -0.57702722, -0.44879895, -0.32057068, -0.19234241, -0.06411414,
        0.06411414,  0.19234241,  0.32057068,  0.44879895,  0.57702722,
        0.70525549,  0.83348377,  0.96171204,  1.08994031,  1.21816858,
        1.34639685,  1.47462512,  1.60285339,  1.73108167,  1.85930994,
        1.98753821,  2.11576648,  2.24399475,  2.37222302,  2.5004513 ,
        2.62867957,  2.75690784,  2.88513611,  3.01336438,  3.14159265])
We will now create some more sophisticated plots. We create three array here
- A vector of the
xvalues (the first dimension), - A vector of the
yvalues (the second dimension), and - An 2D array whose elements correspond to the
zvalue (the third dimension) for each pair of (x,y) coordinates.
plt.figure(figsize=(6,6))

x = np.linspace(-np.pi, np.pi, num=50)
y = x

# simulating R outer function
def pf(a, b):
    return math.cos(b) / (1 + a**2)

f = np.empty((len(x), len(y)))

for i in range(len(x)):
    for j in range(len(y)):
        f[i,j] = pf(x[i], y[j])


# contour plot
cp = plt.contour(x, y, f.T, 45, cmap='viridis')
plt.clabel(cp, inline=1, fontsize=10);
# contour 2
plt.figure(figsize=(6,6))

fa = (f - f.T)/2
cp = plt.contour(x, y, fa.T, 15, cmap='viridis')
plt.clabel(cp, inline=1, fontsize=10);
2.3 Indexing Data
2.4 Loading Data
The data set also includes a number of missing observations, indicated by a question mark ?. Missing values are a common occurrence in real data sets.
# read csv data with pandas into dataframe, explicitly setting na_values.
# pandas read_xxx functions infer datatypes, headers, dates, etc.
# without explicit declarations
Auto = pd.read_csv('/content/drive/MyDrive/Lab/Data/Auto_origin.csv', na_values=['?'])
Auto| mpg | cylinders | displacement | horsepower | weight | acceleration | year | origin | name | |
|---|---|---|---|---|---|---|---|---|---|
| 0 | 18.0 | 8 | 307.0 | 130.0 | 3504 | 12.0 | 70 | 1 | chevrolet chevelle malibu |
| 1 | 15.0 | 8 | 350.0 | 165.0 | 3693 | 11.5 | 70 | 1 | buick skylark 320 |
| 2 | 18.0 | 8 | 318.0 | 150.0 | 3436 | 11.0 | 70 | 1 | plymouth satellite |
| 3 | 16.0 | 8 | 304.0 | 150.0 | 3433 | 12.0 | 70 | 1 | amc rebel sst |
| 4 | 17.0 | 8 | 302.0 | 140.0 | 3449 | 10.5 | 70 | 1 | ford torino |
| ... | ... | ... | ... | ... | ... | ... | ... | ... | ... |
| 392 | 27.0 | 4 | 140.0 | 86.0 | 2790 | 15.6 | 82 | 1 | ford mustang gl |
| 393 | 44.0 | 4 | 97.0 | 52.0 | 2130 | 24.6 | 82 | 2 | vw pickup |
| 394 | 32.0 | 4 | 135.0 | 84.0 | 2295 | 11.6 | 82 | 1 | dodge rampage |
| 395 | 28.0 | 4 | 120.0 | 79.0 | 2625 | 18.6 | 82 | 1 | ford ranger |
| 396 | 31.0 | 4 | 119.0 | 82.0 | 2720 | 19.4 | 82 | 1 | chevy s-10 |
397 rows × 9 columns
# dropping rows (axis-0) where there are NA values (inplace)
Auto.dropna(axis=0, inplace=True)
Auto.shape
(392, 9)<class 'pandas.core.frame.DataFrame'>
Int64Index: 392 entries, 0 to 396
Data columns (total 9 columns):
# Column Non-Null Count Dtype
--- ------ -------------- -----
0 mpg 392 non-null float64
1 cylinders 392 non-null int64
2 displacement 392 non-null float64
3 horsepower 392 non-null float64
4 weight 392 non-null int64
5 acceleration 392 non-null float64
6 year 392 non-null int64
7 origin 392 non-null int64
8 name 392 non-null object
dtypes: float64(4), int64(4), object(1)
memory usage: 30.6+ KB| mpg | cylinders | displacement | horsepower | weight | acceleration | year | origin | |
|---|---|---|---|---|---|---|---|---|
| count | 392.00 | 392.00 | 392.00 | 392.00 | 392.00 | 392.00 | 392.00 | 392.00 |
| mean | 23.45 | 5.47 | 194.41 | 104.47 | 2977.58 | 15.54 | 75.98 | 1.58 |
| std | 7.81 | 1.71 | 104.64 | 38.49 | 849.40 | 2.76 | 3.68 | 0.81 |
| min | 9.00 | 3.00 | 68.00 | 46.00 | 1613.00 | 8.00 | 70.00 | 1.00 |
| 25% | 17.00 | 4.00 | 105.00 | 75.00 | 2225.25 | 13.78 | 73.00 | 1.00 |
| 50% | 22.75 | 4.00 | 151.00 | 93.50 | 2803.50 | 15.50 | 76.00 | 1.00 |
| 75% | 29.00 | 8.00 | 275.75 | 126.00 | 3614.75 | 17.02 | 79.00 | 2.00 |
| max | 46.60 | 8.00 | 455.00 | 230.00 | 5140.00 | 24.80 | 82.00 | 3.00 |
Index(['mpg', 'cylinders', 'displacement', 'horsepower', 'weight',
       'acceleration', 'year', 'origin', 'name'],
      dtype='object')
# changing data type of a column into category
Auto['cylinders'] = Auto['cylinders'].astype('category')
Auto.info()<class 'pandas.core.frame.DataFrame'>
Int64Index: 392 entries, 0 to 396
Data columns (total 9 columns):
# Column Non-Null Count Dtype
--- ------ -------------- -----
0 mpg 392 non-null float64
1 cylinders 392 non-null category
2 displacement 392 non-null float64
3 horsepower 392 non-null float64
4 weight 392 non-null int64
5 acceleration 392 non-null float64
6 year 392 non-null int64
7 origin 392 non-null int64
8 name 392 non-null object
dtypes: category(1), float64(4), int64(3), object(1)
memory usage: 36.3+ KB<matplotlib.axes._subplots.AxesSubplot at 0x7f7c933c7d90>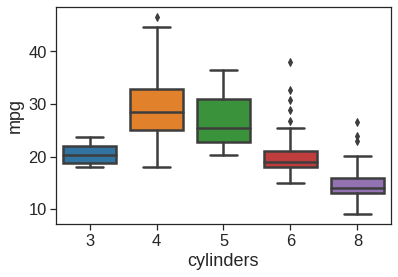
# seaborn pairplot for selected variables, colored by another
sns.pairplot(Auto, vars=['mpg', 'displacement', 'horsepower', 'weight', 'acceleration'], hue='cylinders')
# summary statistics for all dataframe columns, including non-numerical columns
Auto.describe(include='all')| mpg | cylinders | displacement | horsepower | weight | acceleration | year | origin | name | |
|---|---|---|---|---|---|---|---|---|---|
| count | 392.00 | 392.0 | 392.00 | 392.00 | 392.00 | 392.00 | 392.00 | 392.00 | 392 |
| unique | NaN | 5.0 | NaN | NaN | NaN | NaN | NaN | NaN | 301 |
| top | NaN | 4.0 | NaN | NaN | NaN | NaN | NaN | NaN | amc matador |
| freq | NaN | 199.0 | NaN | NaN | NaN | NaN | NaN | NaN | 5 |
| mean | 23.45 | NaN | 194.41 | 104.47 | 2977.58 | 15.54 | 75.98 | 1.58 | NaN |
| std | 7.81 | NaN | 104.64 | 38.49 | 849.40 | 2.76 | 3.68 | 0.81 | NaN |
| min | 9.00 | NaN | 68.00 | 46.00 | 1613.00 | 8.00 | 70.00 | 1.00 | NaN |
| 25% | 17.00 | NaN | 105.00 | 75.00 | 2225.25 | 13.78 | 73.00 | 1.00 | NaN |
| 50% | 22.75 | NaN | 151.00 | 93.50 | 2803.50 | 15.50 | 76.00 | 1.00 | NaN |
| 75% | 29.00 | NaN | 275.75 | 126.00 | 3614.75 | 17.02 | 79.00 | 2.00 | NaN |
| max | 46.60 | NaN | 455.00 | 230.00 | 5140.00 | 24.80 | 82.00 | 3.00 | NaN |
2.5 KNN example
The following code is modified from https://github.com/empathy87/The-Elements-of-Statistical-Learning-Python-Notebooks
- Generates 10 means \(m_k\) from a bivariate Gaussian distrubition for each color:
- \(N((1, 0)^T, \textbf{I})\) for BLUE
- \(N((0, 1)^T, \textbf{I})\) for ORANGE
- For each color generates 100 observations as following:
- For each observation it picks \(m_k\) at random with probability 1/10.
- Then generates a \(N(m_k,\textbf{I}/5)\)
# load training data that was used in the book
df = pd.read_csv("/content/drive/MyDrive/Lab/Data/mixture.txt")
X_train = df[['x1', 'x2']].values
y_train = df.y.values

# set the known BLUE and ORANGE clusters means
blue_means = np.array([[-0.25343316, 1.7414788], [0.26669318, 0.3712341],
                       [2.09646921, 1.2333642], [-0.06127272, -0.2086791],
                       [2.70354085, 0.5968283], [2.37721198, -1.1864147],
                       [1.05690759, -0.6838939], [0.57888354, -0.0683458],
                       [0.62425213, 0.5987384], [1.67335495, -0.2893159]])
orange_means = np.array([[1.19936869, 0.2484086], [-0.30256110, 0.9454190],
                         [0.05727232, 2.4197271], [1.32932203, 0.8192260],
                         [-0.07938424, 1.6138017], [3.50792673, 1.0529863],
                         [1.61392290, 0.6717378], [1.00753570, 1.3683071],
                         [-0.45462141, 1.0860697], [-1.79801805, 1.9297806]])
all_means = np.vstack((blue_means, orange_means))

gaussian_mixture_model = GaussianMixture(
    n_components=20,
    covariance_type='spherical',
    means_init=all_means,
    random_state=1
).fit(all_means)
# set known covariances
gaussian_mixture_model.covariances_ = [1/5]*20
# it looks like a hack, but GaussianMixture uses precisions_cholesky_
# for predict_proba method. Because we changed covariances_ we need
# to recalculate precisions_cholesky_ too.
gaussian_mixture_model.precisions_cholesky_ = _compute_precision_cholesky(
    gaussian_mixture_model.covariances_,
    gaussian_mixture_model.covariance_type)

# sample 10,000 points for testing
X_test, y_test = gaussian_mixture_model.sample(10000)
# y_test contains sampled component indices
# index < 10 means that the class is BLUE (0)
y_test = 1*(y_test >= 10)
def optimal_bayes_predict(X):
components_proba = gaussian_mixture_model.predict_proba(X)
# first 10 components are BLUE(0), and others are BROWN(1)
blue_proba = np.sum(components_proba[:, :10], axis=1)
brown_proba = np.sum(components_proba[:, 10:], axis=1)
y_hat = 1*(blue_proba < brown_proba)
return y_hatbayes_error_rate = 1 - accuracy_score(y_train, optimal_bayes_predict(X_train))
print(f'The optimal Bayes error rate = {bayes_error_rate}')The optimal Bayes error rate = 0.15000000000000002bayes_error_rate = 1 - accuracy_score(y_test, optimal_bayes_predict(X_test))
print(f'The optimal Bayes error rate = {bayes_error_rate}')The optimal Bayes error rate = 0.2148# define commonly used colors
GRAY1, GRAY4, PURPLE = '#231F20', '#646369', '#A020F0'
BLUE, ORANGE, BLUE1 = '#57B5E8', '#E69E00', '#174A7E'
# configure all plots font family and border line widths
plt.rcParams['font.family'] = 'Arial'
plt.rcParams['axes.linewidth'] = 0.5
# prepares a plot with a title and circles representing training data
def plot_train_data(title):
fig, ax = plt.subplots(figsize=(2.8, 2.8), dpi=110)
ax.set_aspect(1.3)
ax.scatter(X_train[:, 0], X_train[:, 1], s=18, facecolors='none',
edgecolors=np.array([BLUE, ORANGE])[y_train])
ax.tick_params(
bottom=False, left=False, labelleft=False, labelbottom=False)
ax.set_xlim(-2.6, 4.2)
ax.set_ylim(-2.0, 2.9)
fig.subplots_adjust(left=0, right=1, top=1, bottom=0)
ax.text(-2.6, 3.2, title, color=GRAY4, fontsize=9)
for spine in ax.spines.values():
spine.set_color(GRAY1)
return fig, ax
# test it
_, _ = plot_train_data('Training data')WARNING:matplotlib.font_manager:findfont: Font family ['Arial'] not found. Falling back to DejaVu Sans.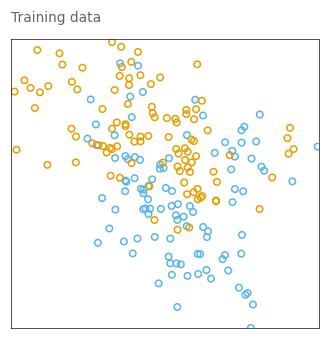
# given a model prediction function computes X points on n x n grid and the
# corresponding predicted classes
def fill_prediction_grid(n1, n2, predict):
    x1, x2 = np.linspace(-2.6, 4.2, n1), np.linspace(-2.0, 2.9, n2)
    X = np.transpose([np.tile(x1, n2), np.repeat(x2, n1)])
    y = predict(X)
    return X, y


# given a model prediction function computes X0 and X1 n x n meshgrids
# and the corresponing predicted classes meshgrid
def fill_prediction_meshgrid(predict):
    n1, n2 = 1000, 1000
    X, y = fill_prediction_grid(n1, n2, predict)
    return X[:, 0].reshape(n1, n2), X[:, 1].reshape(n1, n2), y.reshape(n1, n2)


# given a model prediction function plots train data, model decision
# bounary and background dots
def plot_model(predict, title):
    fig, ax = plot_train_data(title)
    # plot background dots
    X, y = fill_prediction_grid(69, 99, predict)
    ax.scatter(X[:, 0], X[:, 1], marker='.', lw=0, s=2,
               c=np.array([BLUE, ORANGE])[y])
    # plot the decision boundary
    X0, X1, Y = fill_prediction_meshgrid(predict)
    ax.contour(X0, X1, Y, [0.5], colors=GRAY1, linewidths=[0.7])
    return fig, ax

# plot the optimal Bayes decision boundary
_, _ = plot_model(optimal_bayes_predict, 'Bayes Optimal Classifier')
# lets save Bayes meshgrids for optimal decision boundary plotting
X0_bayes, X1_bayes, Y_bayes = fill_prediction_meshgrid(optimal_bayes_predict)


# given a model prediction function plots performance statistics
def plot_model_stat(predict, title):
    fig, ax = plot_model(predict, title)
    ax.contour(X0_bayes, X1_bayes, Y_bayes, [0.5], colors='purple',
               linewidths=[0.5], linestyles='dashed')
    test_error_rate = 1 - accuracy_score(y_test, predict(X_test))
    train_error_rate = 1 - accuracy_score(y_train, predict(X_train))
    parms = {'color': GRAY1, 'fontsize': 7,
             'bbox': {'facecolor': 'white', 'pad': 3, 'edgecolor': 'none'}}
    ax.text(-2.42, -1.35, f'Training Error: {train_error_rate:.3f}', **parms)
    ax.text(-2.42, -1.62, f'Test Error:       {test_error_rate:.3f}', **parms)
    ax.text(-2.42, -1.89, f'Bayes Error:    {bayes_error_rate:.3f}', **parms)
    return fig, ax
# Run GridSearchCV to find the best n_neighbors parameter using the 10-folds
# CV. It finds 12, but the book uses 15-Nearest Neighbor Classifier because
# the authors selected the most parsimonious model within one standard error
# from the best model (one standard error rule). We will apply this rule in
# other examples, not here.
k_neighbors_grid_search = GridSearchCV(
KNeighborsClassifier(),
{'n_neighbors': list(range(1, 50))},
cv=10
).fit(X_train, y_train)
k_neighbors_grid_search.best_params_{'n_neighbors': 12}# PAGE 14. Use 15-nearest-neighbor averaging of the binary coded response as
# the method of fitting. Thus Y-hat is the proportion of ORANGE’s in
# the neighborhood, and so assigning class ORANGE to G-hat if
# Y-hat>0.5 amounts to a majority vote in the neighborhood.
neighbors15_classifier = KNeighborsClassifier(
n_neighbors=15
).fit(X_train, y_train)
_, _ = plot_model_stat(
neighbors15_classifier.predict, '15-Nearest Neighbor Classifier')WARNING:matplotlib.font_manager:findfont: Font family ['Arial'] not found. Falling back to DejaVu Sans.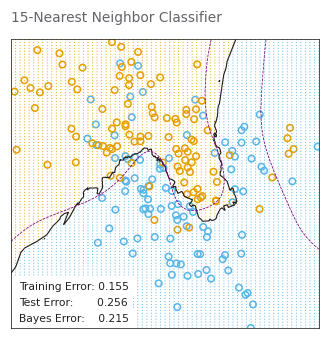
# PAGE 16. The classes are coded as a binary variable (BLUE = 0,ORANGE = 1),
#          and then predicted by 1-nearest-neighbor classification.
neighbors1_classifier = KNeighborsClassifier(
    n_neighbors=1
).fit(X_train, y_train)
_, _ = plot_model_stat(
    neighbors1_classifier.predict, '1−Nearest Neighbor Classifier')
n_neighbors_vals = list(range(1, 30, 2))
k_neighbors_grid_search = GridSearchCV(
    KNeighborsClassifier(),
    {'n_neighbors': n_neighbors_vals},
    cv=10, scoring='accuracy',
    return_train_score=True
).fit(X_train, y_train)

train_errors, test_errors = [], []
for k in n_neighbors_vals:
    clf = KNeighborsClassifier(n_neighbors=k).fit(X_train, y_train)
    train_errors.append(1 - clf.score(X_train, y_train))
    test_errors.append(1 - clf.score(X_test, y_test))
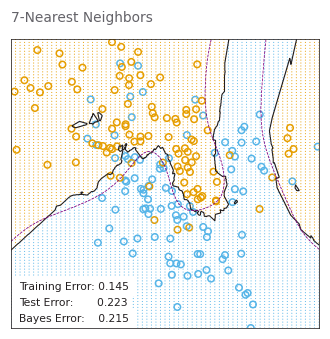
# PAGE 467. k-nearest-neighbors on the two-class mixture data. The upper
# panel shows the misclassification errors as a function of
# neighborhood size. Standard error bars are included for 10-fold
# cross validation. The lower panel shows the decision boundary
# for 7-nearest-neighbors, which appears to be optimal for minimizing
# test error.
cv_erros = 1 - np.vstack([
k_neighbors_grid_search.cv_results_[f'split{i}_test_score']
for i in range(10)]).T
cv_mean_errors = np.mean(cv_erros, axis=1)
cv_std_errors = np.std(cv_erros, ddof=1, axis=1)/np.sqrt(10)
best_index = np.argmin(cv_mean_errors)
best_err, best_std_err = cv_mean_errors[best_index], cv_std_errors[best_index]
fig, ax = plt.subplots(figsize=(2.8, 2.8), dpi=110)
fig.subplots_adjust(left=0, right=1, top=1, bottom=0)
ax.scatter(n_neighbors_vals, test_errors, c='#0000FF', s=9)
ax.plot(n_neighbors_vals, test_errors, c='#0000FF', linewidth=0.8,
label='Test Error')
ax.plot(n_neighbors_vals, cv_mean_errors, c='#00FF00', linewidth=0.8,
label='10-fold CV')
ax.scatter(n_neighbors_vals, train_errors, c=ORANGE, s=9)
ax.plot(n_neighbors_vals, train_errors, c=ORANGE, linewidth=0.8,
label='Training Error')
ax.errorbar(n_neighbors_vals, cv_mean_errors,
color='#00FF00', linestyle='None', marker='o', elinewidth=0.8,
markersize=3, yerr=cv_std_errors, ecolor='#00FF00', capsize=3)
ax.axhline(y=best_err+best_std_err, c=PURPLE, linewidth=0.8, linestyle='--',
label='Bayes Error')
for i in ax.get_yticklabels() + ax.get_xticklabels():
i.set_fontsize(6)
ax.set_xlabel('Number of Neighbors', color=GRAY4, fontsize=8)
ax.set_ylabel('Misclassification Errors', color=GRAY4, fontsize=8)
neighbors7_classifier = KNeighborsClassifier(
n_neighbors=7).fit(X_train, y_train)
plot_model_stat(neighbors7_classifier.predict, '7-Nearest Neighbors')
_ = ax.legend(loc='best', prop={'size': 8})WARNING:matplotlib.font_manager:findfont: Font family ['Arial'] not found. Falling back to DejaVu Sans.
WARNING:matplotlib.font_manager:findfont: Font family ['Arial'] not found. Falling back to DejaVu Sans.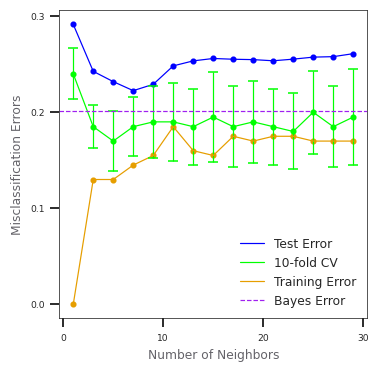
2.6 References
[1] https://web.stanford.edu/~hastie/ElemStatLearn/
[2] https://github.com/emredjan/ISL-python
[3] https://github.com/empathy87/The-Elements-of-Statistical-Learning-Python-Notebooks


